Released: November 2019
Summary
The dashboard widgets which utilized Flash charts have been rebuilt. The widgets that have been improved are:
Revenue Projection (Executive)
Revenue Projection (Broker)
Revenue (Closed Deals)
Payment Summary
Starting in 2020 Google Chrome will no longer support Flash. The new improved charts do not require Flash.
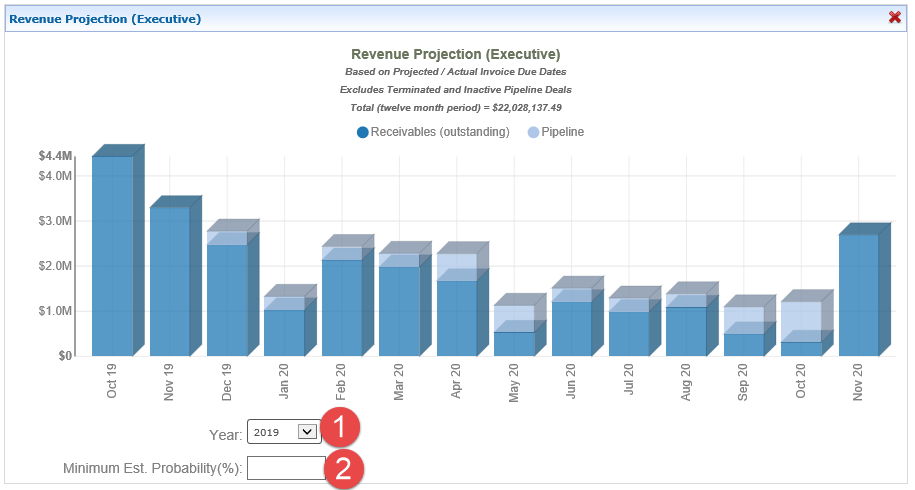
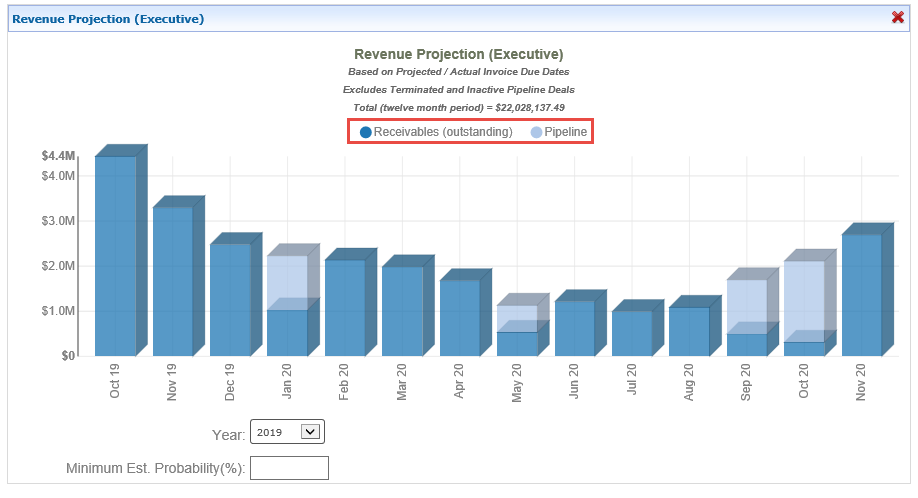
Revenue Projection (Executive)
The new Revenue Projection (Executive) widget has multiple filtering options.
Legend filtering options: by clicking on the dot next to the legend label the data can be turned on or off. The 'Total’ in the header will recalculate to match the selection.
Receivables (outstanding)
Pipeline

Standard filtering options:
Year - filtering by a specific year can be accomplished by using the ‘Year’ pulldown option.
Minimum Est. Probability (%) - filtering by a minimum Pipeline probability amount can be accomplished by entering the desired minimum probability.
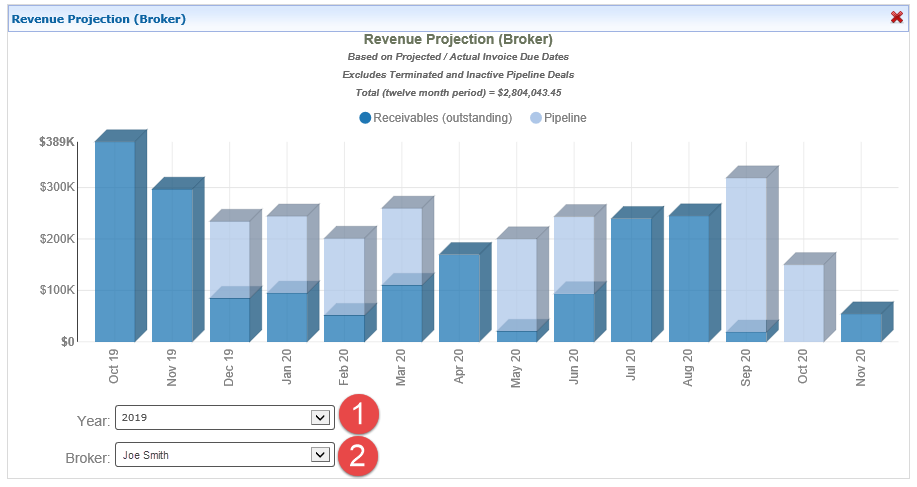
Revenue Projection (Broker)
The new Revenue Projection (Broker) widget has multiple filtering options.
Legend filtering options: by clicking on the dot next to the legend label the data can be turned on or off. The 'Total’ in the header will recalculate to match the selection.
Receivables (outstanding)
Pipeline

Standard filtering options:
Year - filtering by a specific year can be accomplished by using the ‘Year’ pulldown option.
Minimum Est. Probability (%) - filtering by a minimum Pipeline probability amount can be accomplished by entering the desired minimum probability.
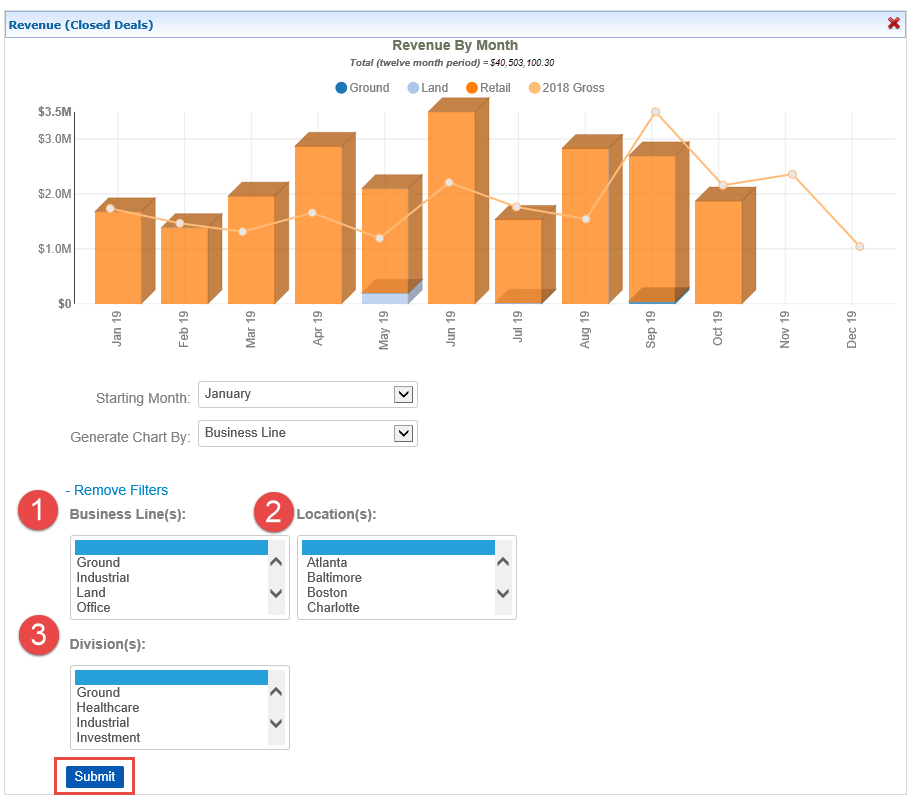
Revenue (Closed Deals)
The new Revenue (Closed Deals) widget has multiple filtering options.
Generate Chart By:
Business Line (default)
Division
Location
The ‘Generate Chart By’ pulldown can be used to select different options.

Starting Month: the starting month of this chart can be changed by selecting the desired month in the ‘Starting Month' pulldown.

Legend filtering options: by clicking on the dot next to the legend label the data can be turned on or off. The legend values are dynamically generated based on the selection of the ‘Generate Chart By’ selection. The 'Total’ in the header will recalculate to match the selections made.

+ Apply Filters: there are additional filtering options under the ‘+ Apply Filters’ link. The filter options are:
Business Line
Division
Location
Once the selection is made, the submit button is required to apply the additional filters.
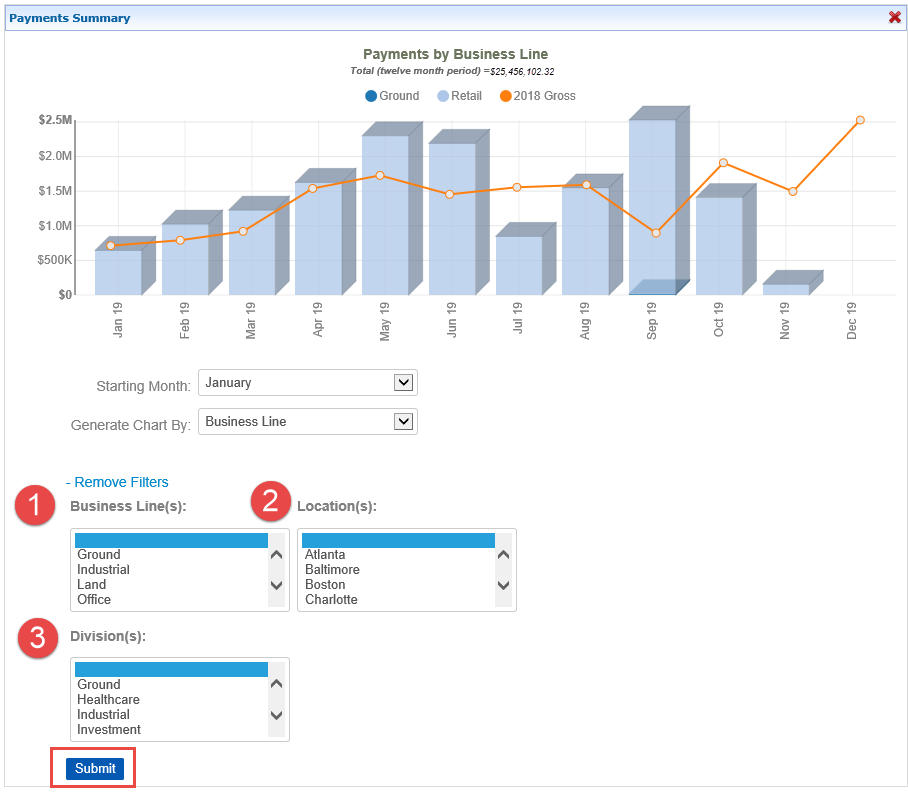
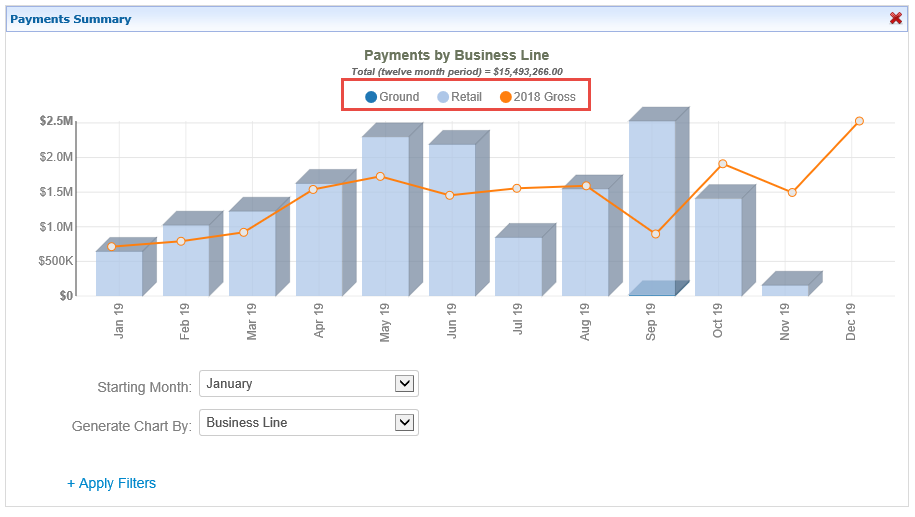
Payment Summary
The new Payment Summary widget has multiple filtering options.
Generate Chart By:
Business Line (default)
Division
Location
The ‘Generate Chart By’ pulldown can be used to select different options.
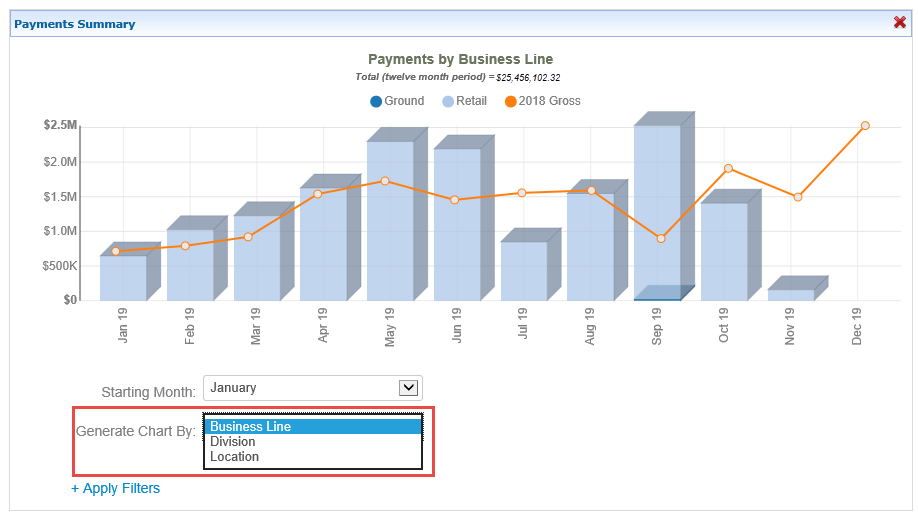
Starting Month: the starting month of this chart can be changed by selecting the desired month in the ‘Starting Month' pulldown.

Legend filtering options: by clicking on the dot next to the legend label the data can be turned on or off. The legend values are dynamically generated based on the selection of the ‘Generate Chart By’ selection. The 'Total’ in the header will recalculate to match the selections made.

+ Apply Filters: there are additional filtering options under the ‘+ Apply Filters’ link. The filter options are:
Business Line
Division
Location
Once the selection is made, the submit button is required to apply the additional filters.
If you have any questions or would like to schedule a detailed training on this feature, please contact [email protected].
© 2023 CoStar Group