Web Reports are run from one of several widgets on the main dashboard. While each report serves a specific purpose, there are some common features among all or most of them.

Topics in this article
Click on a topic to jump to that part of the page.
SSRS vs. Legacy Reports
Many Web Report names have an [SSRS] label. This indicates that the report is using a newer report technology. We are in the process of replacing all of the older reports with SSRS versions. If you see the same report name listed twice - one with the [SSRS] label and one without - select the SSRS version. It will be the most up-to-date version and may have more options or enhancements.
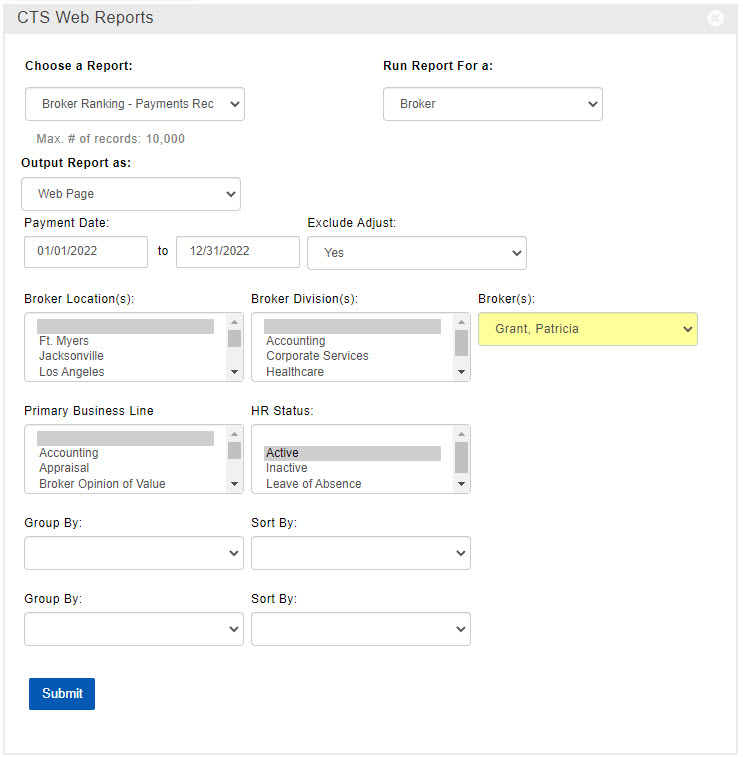
Filter Options
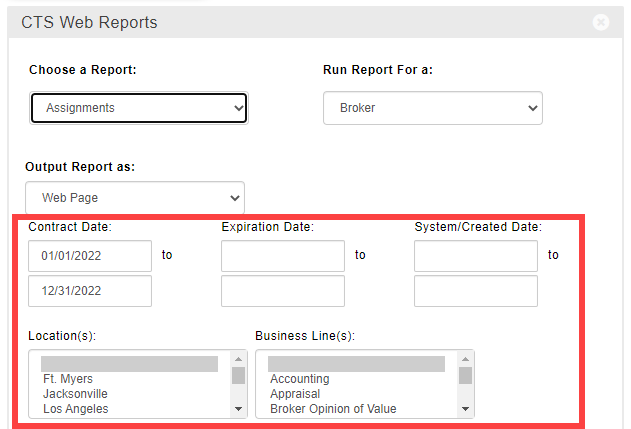
Generally speaking, each Web Report is already “pre-filtered” to display only relevant records for that report’s specific purpose. For example, a Lease Expiration report is only going to include Deals which contain a Lease Expiration Date. Depending on the report, you can add more filters to make sure the results meet your specific requirements. Common filters include key dates or amounts, Locations, Business Lines, Deal Type(s), and more.
Regardless of any filters you apply, you will always only see information on records for which you are allowed to see the report contents.
Grouping and Sorting
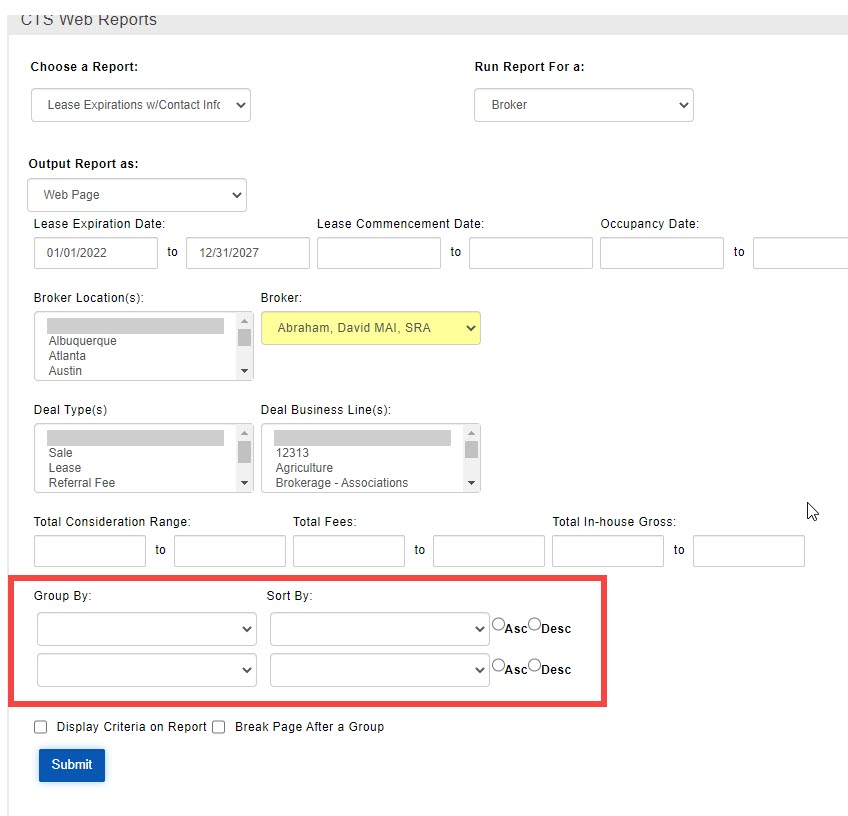
Most reports will have at least one grouping option. Some allow for more than one grouping level. Grouping will separate the report information based on the field(s) you select. The report may also calculate subtotals or averages for each group.
All reports have a default sort order for the information they display - usually based on a key piece of information, such as important names or dates. You can also indicate your own sorting preferences in different ways, depending on the report. In some cases, the Sort By option can be set before running the report.
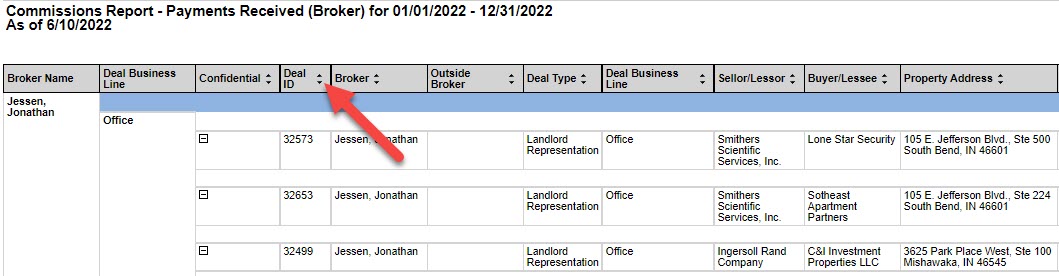
For other reports, you can sort the information on your screen after running the report. If you see up/down arrows next to the column header, click on the arrows to sort the report by that field.
Records are always grouped first and then sorted within each group. If you want to sort the entire report by that field, you will need to remove any Group By options before running the report.
Most reports that have a spreadsheet-like layout can be exported to Excel and sorted in that app any way you wish. See below for more details on exporting reports.
Display Options
Some reports will have one or more options that determine if or how information displays on the report. Those options are usually towards the bottom of the widget.
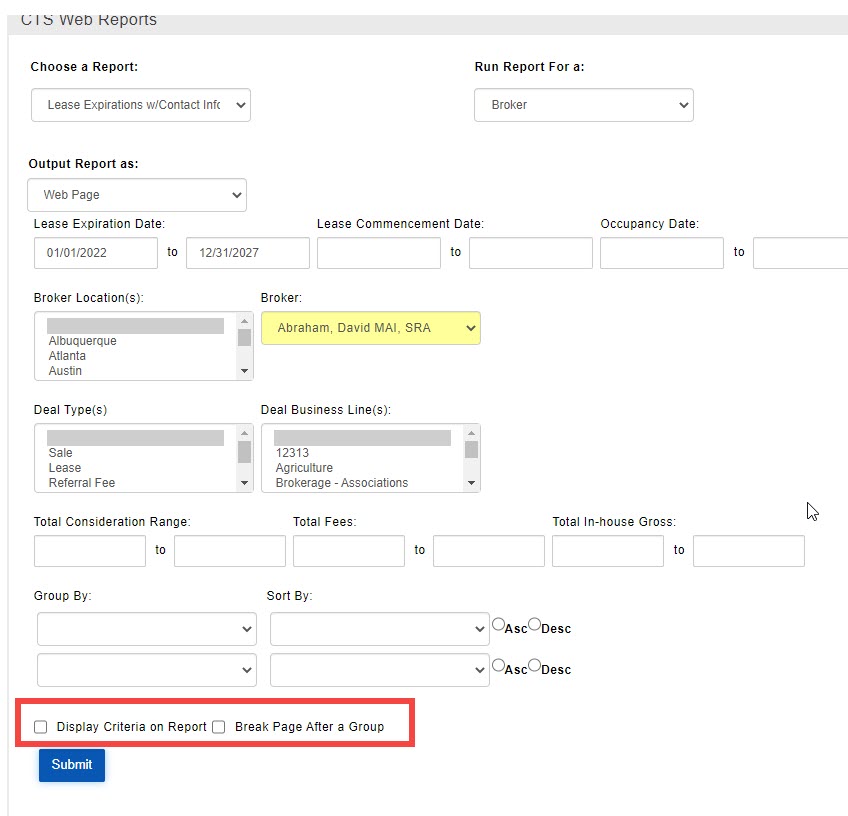
Display Criteria on Report - The report will include a brief description of the filter criteria you selected on the widget before running the report.
Break Page After a Group - If the information on the report is grouped, each new group will start on the next page. Useful if you need to send the results for different groups to different people.
Do Not Repeat Deal Data - If the information on the report is grouped, fields with identical values will display only once for each group instead of repeating on each line. E.g. a report with multiple Payments for the same Deal will show the Deal information only once if the report is grouped by Deal ID.
Note: Make sure this box is unchecked if you plan to export the report to Excel and use it as a spreadsheet for further analysis.Show Details - When this box is not checked, the report displays only the subtotals and totals for each selected grouping, with the option to expand each group to see its contents. When this box is checked, each group is expanded on the report as soon as it opens.
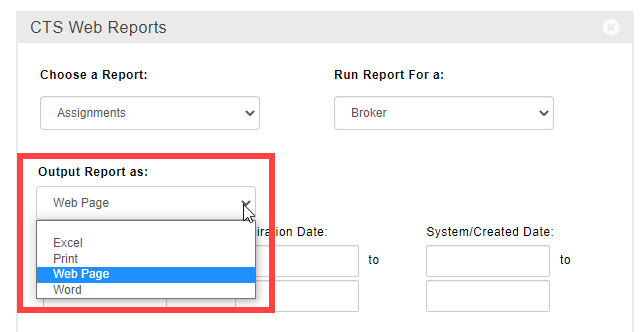
Output / Export Options
For some reports, you can choose how you want the report to be output before running it.

In other cases, the report will come up on screen first, then you’ll see an option to export the report to different formats.

The most commonly used export formats are:
Excel: For reports that have the format of a spreadsheet, this may be an ideal export option. You can create a slimmed down version, rearrange the columns, or slice and dice the data as you wish using Excel features.
Note: Remove all Group By options and uncheck the box next to “Do Not Repeat Deal Data” before running the report to make the information easier to work with in Excel.PDF: This is a great option for storing the report for future use, or for sending a read-only version along to others.
Word: Many use this option to add logos, or to add the creative touches that are good for presentations.
Related Articles
© 2023 CoStar Group